Insight Reports
Insight reports are a way to get a comprehensive, report-style view of your environment. These reports show a list of devices - whether it's all devices or a subset of them - along with three categories of information: info/metadata, due dates (or schedules), and sensors (aggregated data over time).
Categories
Permalink to “Categories”Info/Meta Data
Permalink to “Info/Meta Data”This data consists of information that doesn't change very often or at all - things like serial numbers, device firmware versions, or manufacture date. Some or all of this data can be pulled directly from the devices and is auto-updated once per day. The Critical Labs gateway also has an action that can pull this data on demand.
This information can be manually updated as well, giving you the power to have a complete picture of your environment.
Due Dates (Schedules)
Permalink to “Due Dates (Schedules)”Due dates allow you to setup schedules for your devices. The schedule starts with a starting date (which can be an info/metadata column if available). You can then specify the interval between the start date and the due date. This will calculate a due date, which will turn yellow within 6 weeks of the due date and red within 2 weeks of the due date.
Sensors
Permalink to “Sensors”Sensor data in an insight report works a little differently than sensor data in a dashboard, but it is the same type of data. You can display things like temperature, humidity, and percent load, but instead of trending it over time or showing the last read value, insights will display this information as an average, minimum, or maximum value within a specific time range. This time range is variable and defaults to 30 days.
Creating an Insight Report
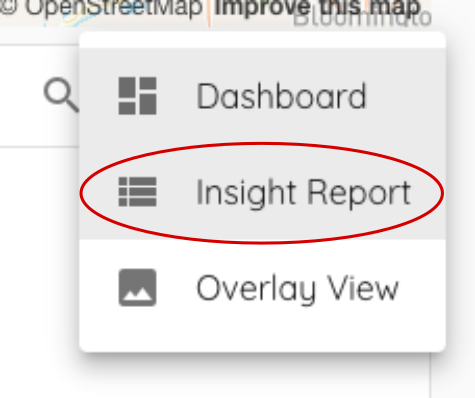
Permalink to “Creating an Insight Report”Insight reports are a special type of view and are created from the My Views page. From the My Views page, you can click the add button and select Insight Report to create a report.
Managing Devices
Permalink to “Managing Devices”Reports can contain different subsets of devices to help you manage and understand different aspects of your environment. There are a couple of different ways to manage which devices show up in your reports: you can manually add and remove devices, or you can automatically manage devices by their type and/or by device tags.
Device tags are different from view tags. They are managed via the Equipment Page.
Auto-manage
Permalink to “Auto-manage”When you create an insight report, there is an option to auto-manage devices that are included in the report. This can be done via device type or by device tagging. When auto-manage is turned on, any new devices of the specified type(s) with the specified tag(s) will be automatically added to the report.
You can choose to manage the report via device or device tags or both. You can select multiple device types to be included in the report, and you can select tags by either requiring at least one tag in a list to be present or all tags in a list to be present.
You can set up auto-management when you create an insight report or from within the report by clicking "Edit" then selecting "Auto-Manage" at the top of the page.


Manual Management
Permalink to “Manual Management”You can also manually add devices to a report, even a report that is auto-managed. You can do this from the insight report page by clicking "Edit" and Selecting the "Add" button next to "Devices". When you manually add a device to a report, it can also be manually removed. Devices that are added to a report via auto-manage cannot be manually removed.

Managing Report Columns
Permalink to “Managing Report Columns”When you create a new insight report, by default there will be no data columns present. You will need to select which type of data you want to see in the report. This can be done by clicking the "Edit" button then selecting "Manage" next to "Columns". This will bring up the column management popup.
There are three categories of columns you can add to insight reports. For more information on these categories, see the Categories section at the top of this page.
For Info/Meta columns, you can simply select which columns you want to see in your report. You can also manually add columns to your report from the Info/Meta section. Note that manual columns will not auto-populate, and data will need to be filled out manually.
Note that it may take time for data to show up in a report if it was not being monitored. For sensors, this is a poll cycle (typically 5 minutes). For info/metadata, this can be up to a day. To get info/metadata sooner, initiate a "Poll Asset Data" gateway action from the Equipment page under the Gateways tab.
For due dates/schedules, you will need to specify a reference meta column or a static date to calculate the due date from. A reference column must have data in a recognizable date format to be used in a schedule. If you specify a reference column and a static date, then the static date will be used as a fallback if the reference column does not have a recognizable date. Specify an interval to finish calculating a due date/schedule.
Sensor (aggregation) columns can be created from a template. This is the fastest way to build a sensor column. If not using a template, then the column will be added initially without any data. Specify the name of the column and the aggregation type (average, min, max) and save the column.
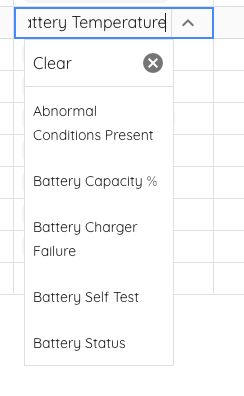
To populate a non-templated column from scratch, close out of the column management popup. Click on a cell that is in the non-templated column, and a dropdown will open showing all available sensor options.
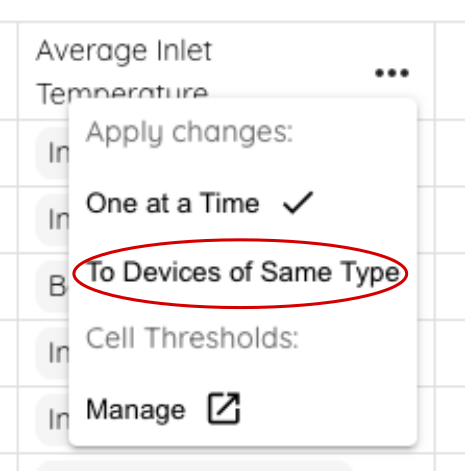
Data can be populated in this column in bulk by clicking on the "more" menu next to the non-templated column header:

Under "Apply changes", select "To Devices of Same Type".
When you select a cell now, if there are multiple devices of the same type in your report, all the cells of that device type in that column will show purple:
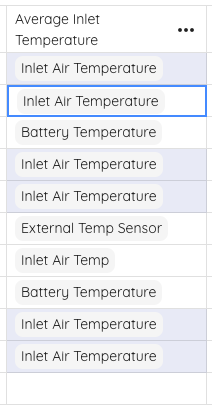
When you select a sensor option from the dropdown, it will apply to all the cells of that device type.
Thresholds
Permalink to “Thresholds”Info/Meta columns and sensor columns can have thresholds set on them that can change the color of the cell when a value matches or exceeds said thresholds. Schedule columns have a built-in color coding system based on the amount of time left before a due date and cannot be changed currently. The following info/meta columns also have a pre-defined set of thresholds that will be applied by default:
- Network Card Firmware Version
- Network Card Type
To change a threshold on a column from an insight report, select "Edit", then click the "more" menu text to a column header:


Select "Cell Thresholds > Manage"
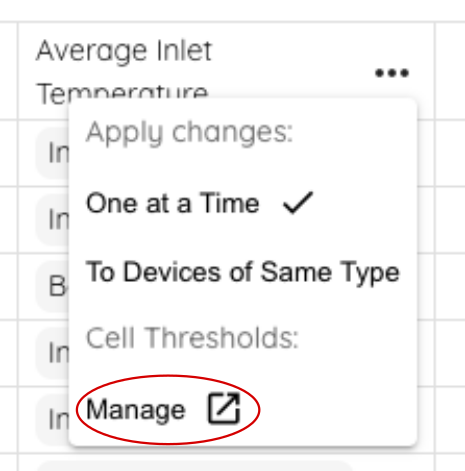
You can set a warning threshold, a critical threshold, and an optional default color. Click "Save" to save the threshold for that column.
To remove thresholds, simply click "Cell Thresholds > Manage" from the "more" menu and deselect all threshold options. This will remove any custom thresholds from your column. Note that pre-defined thresholds will remain if they are present.
Editing Report Data
Permalink to “Editing Report Data”There are some instances where metadata does not automatically populate, or perhaps you create a custom column that you wish to populate with your own data. Each cell has the capability of being manually updated, even overriding the metadata that was pulled from the device.
To edit a cell from an insight report, simply click the "Edit" button then double-click on a cell to change it:
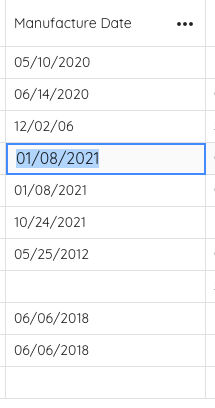
To save the cell, simply click on a different cell or click the "Done" button.
You may notice that a cell that you have updated manually has an icon that looks like this:

This icon indicates that the data in this cell has been manually updated and should not attempt to pull automatically from the device.
If the cell has an icon like this:

Then this cell will attempt to populate with data from the device on a daily schedule.
Copy/pasting
Permalink to “Copy/pasting”Sometimes when you are editing data, you might need to apply the same data to a lot of cells in the same column. There are a couple of ways to manage this more quickly than clicking into every cell and editing.
The first way is to change the selection setting of the column. This is done by clicking the "more" menu next to the column header and changing the setting in "Apply Changes".

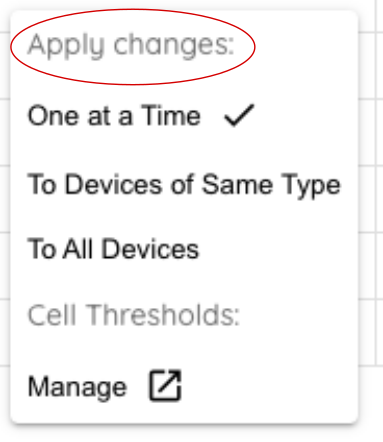
The cells that will update with your changes will be highlighted in purple as you are editing.
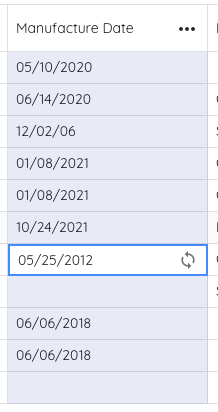
The second way to apply a value to multiple cells is to click on the cell you are want to copy and to hold down Ctrl+C (Command+C for Mac) to copy the current cell. A dashed border will indicate that this cell is being copied.
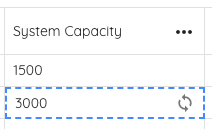
Now click on another cell and hold down Ctrl+V (Command+V for Mac). This will paste the copied value into the new cell.
Downloading a Report
Permalink to “Downloading a Report”You can download a report as a spreadsheet to use locally in one of the following formats: csv and xlsx. An xlsx report will include threshold colors, and a csv will be a simpler text file.
Click the "Download" button at the top of the page to download the report.

Scheduling Email Reports
Permalink to “Scheduling Email Reports”Once you have an insight report setup, you can set up a schedule to receive this report as an email at regular intervals. Email schedules can be setup in the Settings page under "Email schedules".
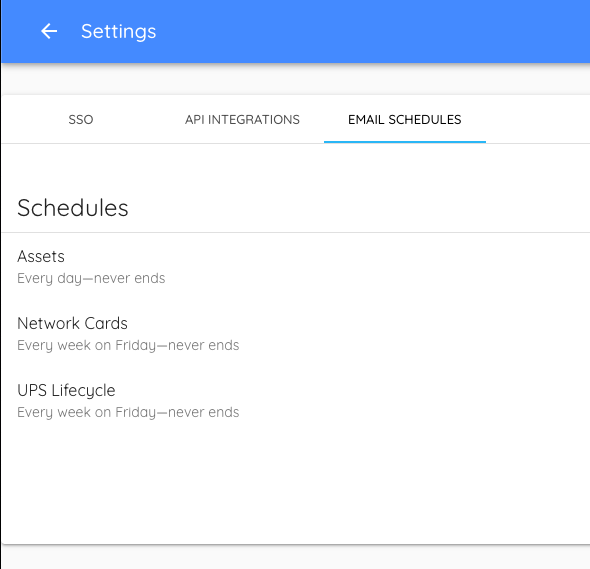
You can also get to this page from your insight report by clicking the "Email Schedules" button.
