Creating a Dashboard
Views are the main visual representation of information in Critical Labs. They are also how Critical Labs knows who will receive alerts on what information. There are 3 different types of views in Critical Labs:
- Dashboards
- Overlay Views
- Asset Views
Overlay Views and Asset Views
Permalink to “Overlay Views and Asset Views”This guide is going to cover specifically how to setup a dashboard view. However, it’s helpful to understand the capabilities of overlay views and asset views as well.
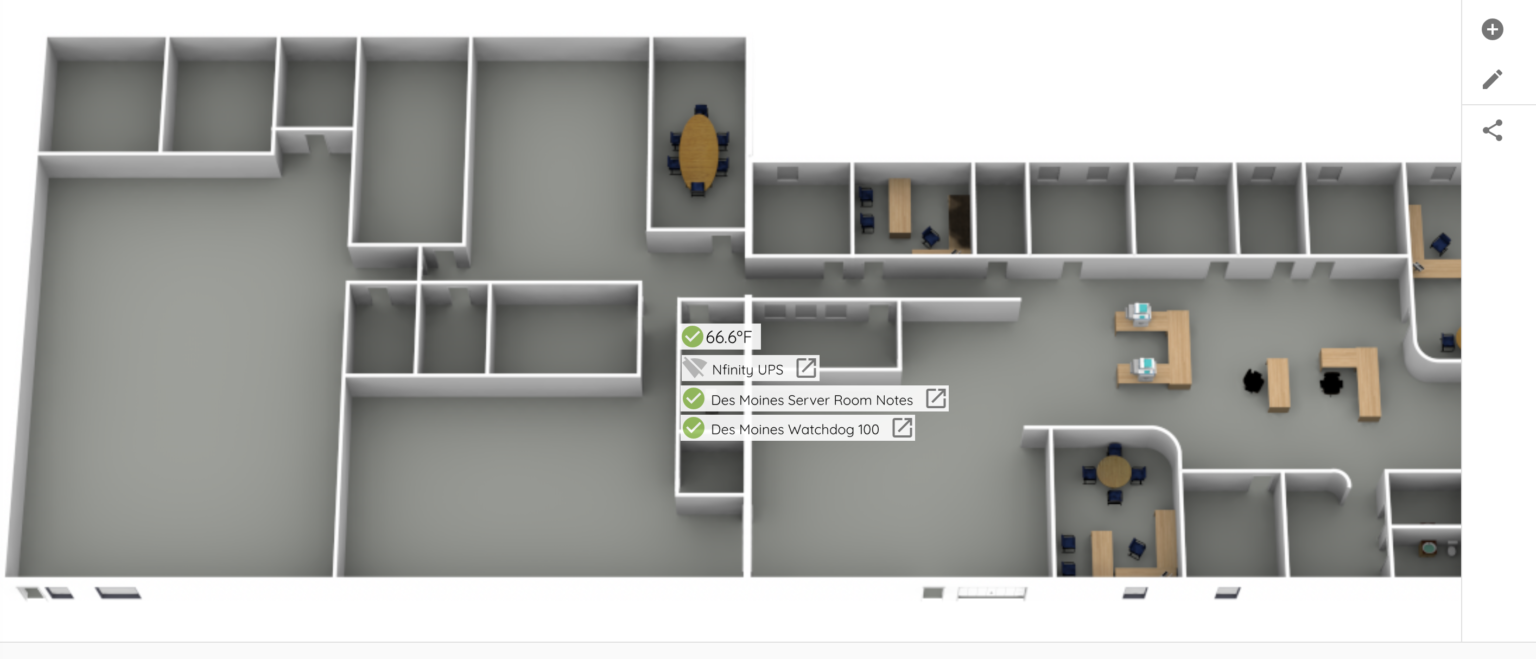
Overlay views are a non-alerting type of view that displays sensor data over an uploaded image. They are useful for primarily visual data such as data center layouts, one-line diagrams, and heat maps.
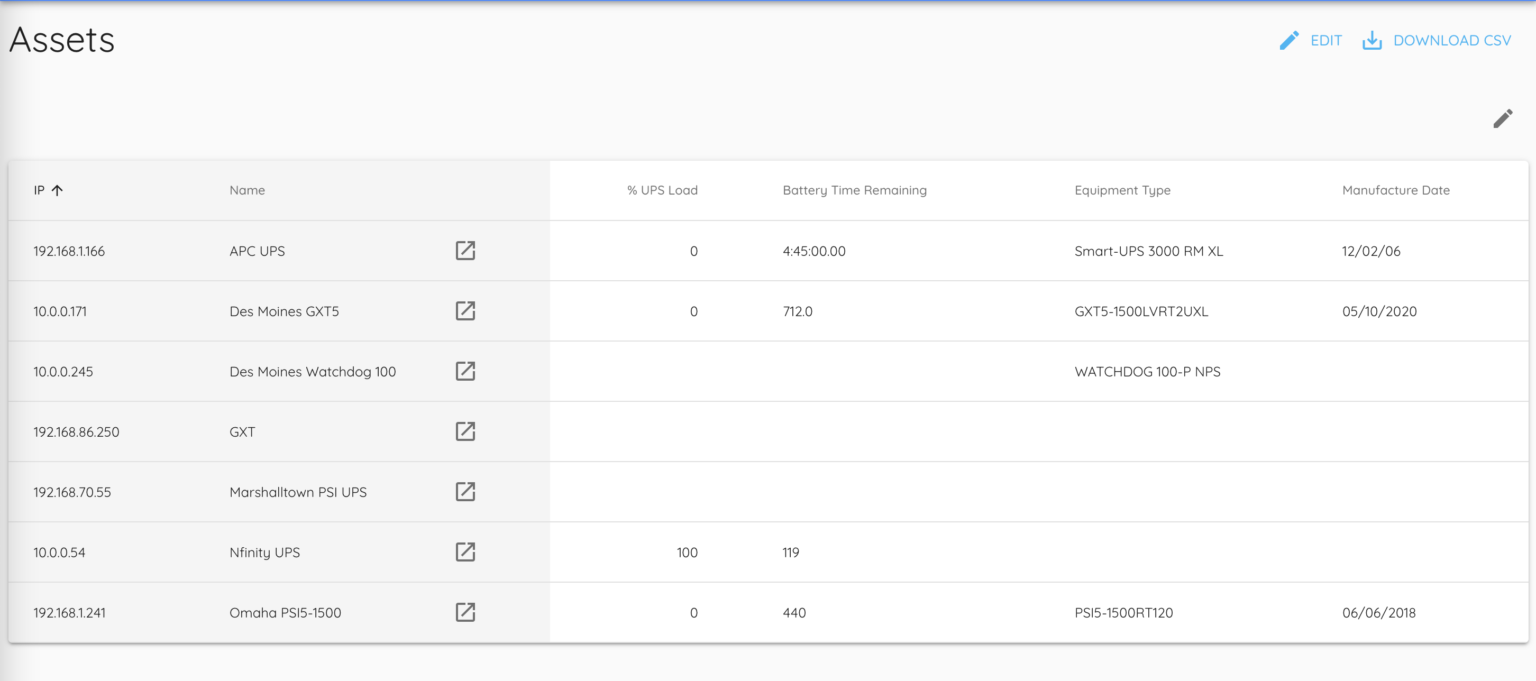
Asset views are a special type of view that deals with non-sensor, informational data, such as serial numbers or dates of install. In Critical Labs, this data is updated only once a day, and no alerts are sent from this data.
Asset views are lists of equipment that show informational data in a grid format for quick, sortable reference. They are especially useful for asset management and capacity planning.
Adding a Dashboard
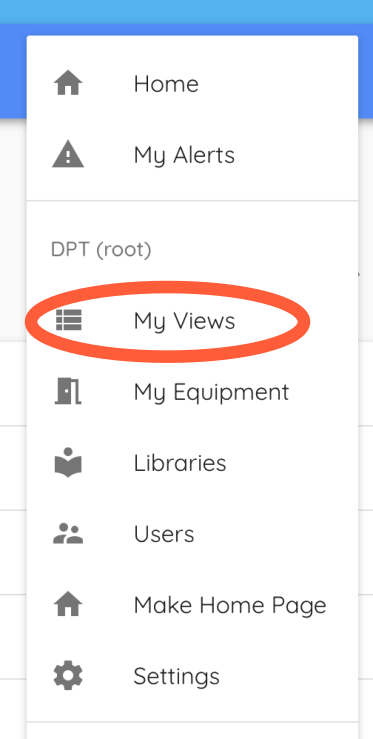
Permalink to “Adding a Dashboard”Go to the My Views page by opening the top righthand menu and selecting My Views.
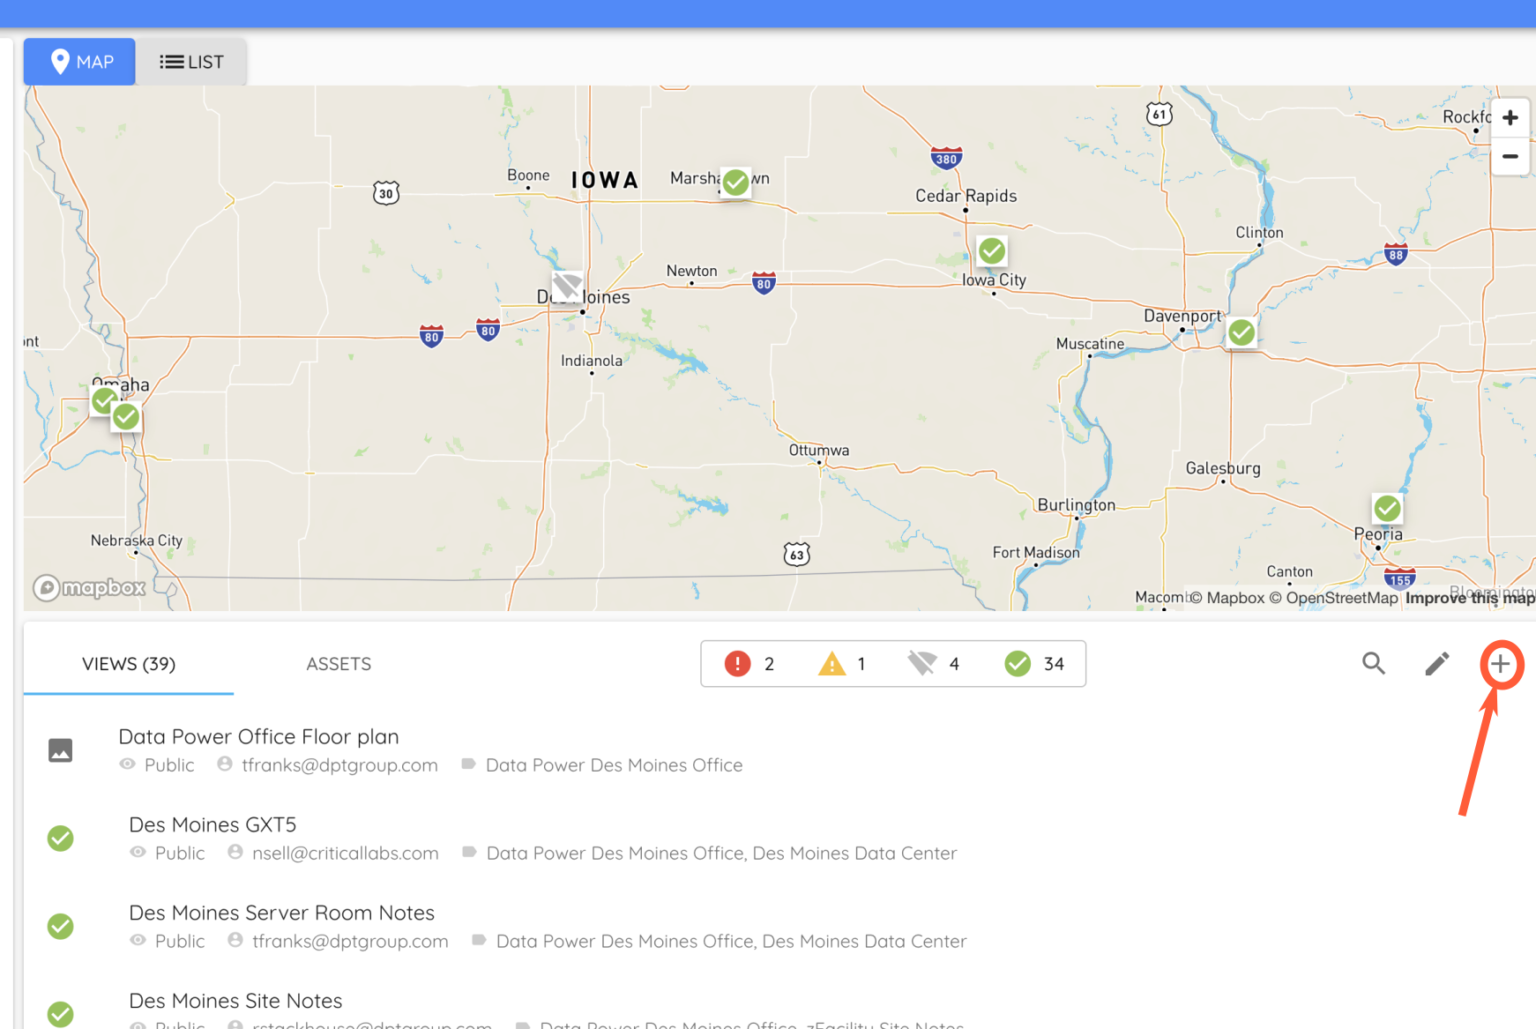
You should now be on the My Views page.
Click the add button to the top right of the view list.
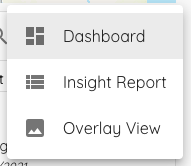
In the popup that appears, choose Dashboard.
A screen will pop up, allowing you to set the details of the new dashboard. You can setup the name, tags, permissions, and alerts from this screen.
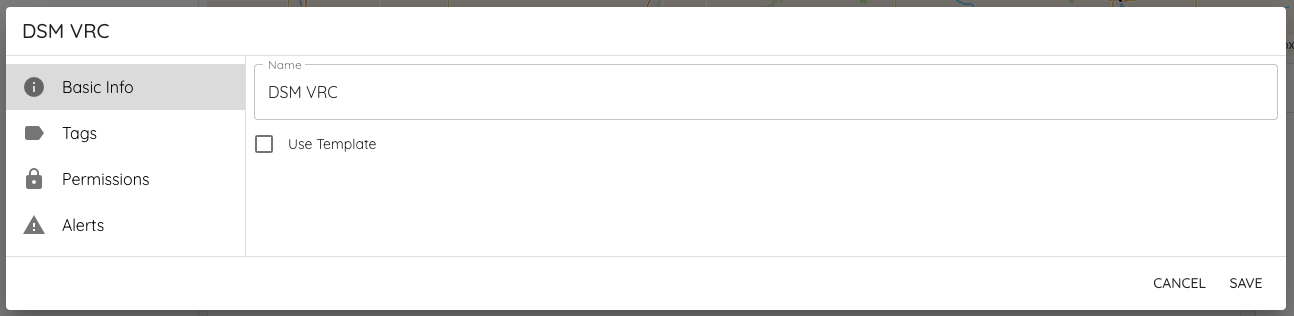
The following special characters are currently not allowed in view names:
_~!@#$&*()=:/,;?+'Duplicate view names are not allowed in Critical Labs.
Using a View Template
Permalink to “Using a View Template”If you want to create a dashboard for a specific device or number of devices, you will likely want to use a view template. View templates have a predefined structure and set of sensor data that will automatically be added to any devices you template. To use a View Template, on the Basic Info tab, check the Use Template box.
This will allow you to select one or more of your connected devices to be featured in the template.
Note that if you lock your devices from being changed, then you will have to unlock them first. This is because view templates will automatically add sensor data to your selected devices to populate the template.
Select a device (or devices) that you want to appear in a single template. If you select multiple devices, the system will attempt to find a template that matches multiple devices in a single dashboard.
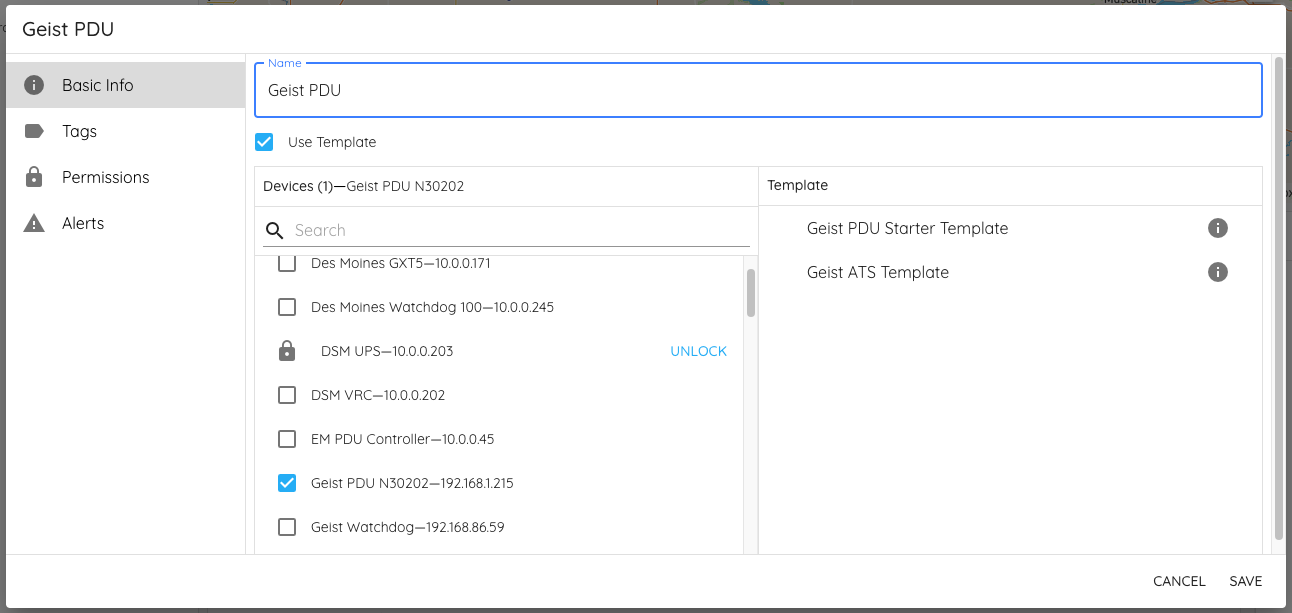
After selecting your equipment, a list of possible templates appears on the right-hand side. If no templates appear, then there is no predefined template for the device (or device combination) that you selected. If this is the case, you can either create a dashboard from scratch or reach out to Critical Labs support to assist you.
Adding Tags
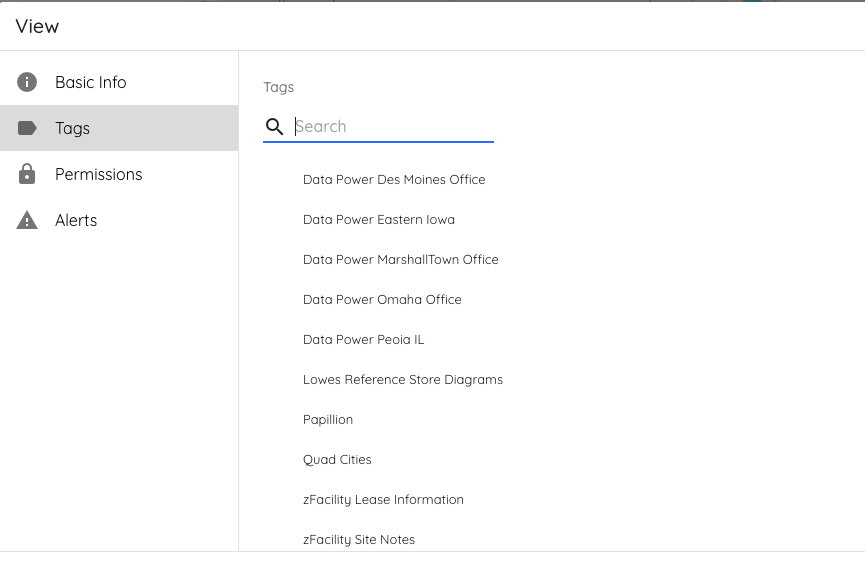
Permalink to “Adding Tags”One of the options available to a dashboard is tagging. Tags are a good way to organize your views into categories to help you find them easier. Tags can be geographic (such as a location on a map) or simply text. Tags can also be nested underneath each other.
If you have any tags setup in your account, feel free to choose a tag or two to tag your new view.
Permissions
Permalink to “Permissions”The next tab is permissions. This is how you determine who can see your dashboard in Critical Labs.
Public views are views that are visible to any users with a login to your company account. They are not visible to anyone outside of your account.
Private views are views that only you and your account administrators can see. You can manually select other users to see private views. You can also setup who can edit this view and who can share it with others.
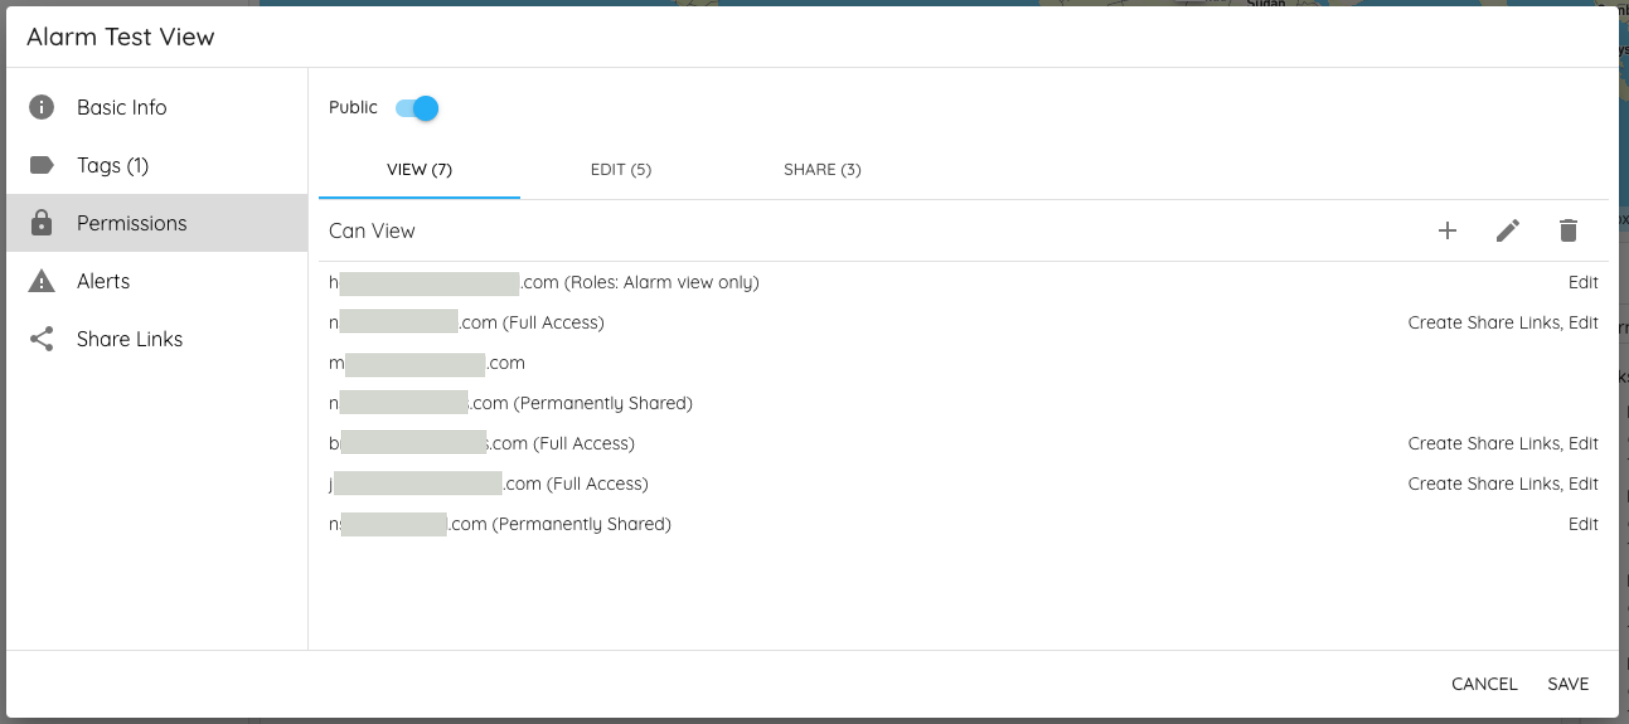
There are additional dashboard permissions called Share Links and Permanent Shares, but they cannot be setup when creating a dashboard. They can, however, be added later after the view has been created. See Sharing Dashboards for more information.
Setting up Alert Notifications
Permalink to “Setting up Alert Notifications”The final tab is alerts. From here, you can setup who gets emails for warning alerts, critical alerts, and equipment disconnect alerts from this dashboard.
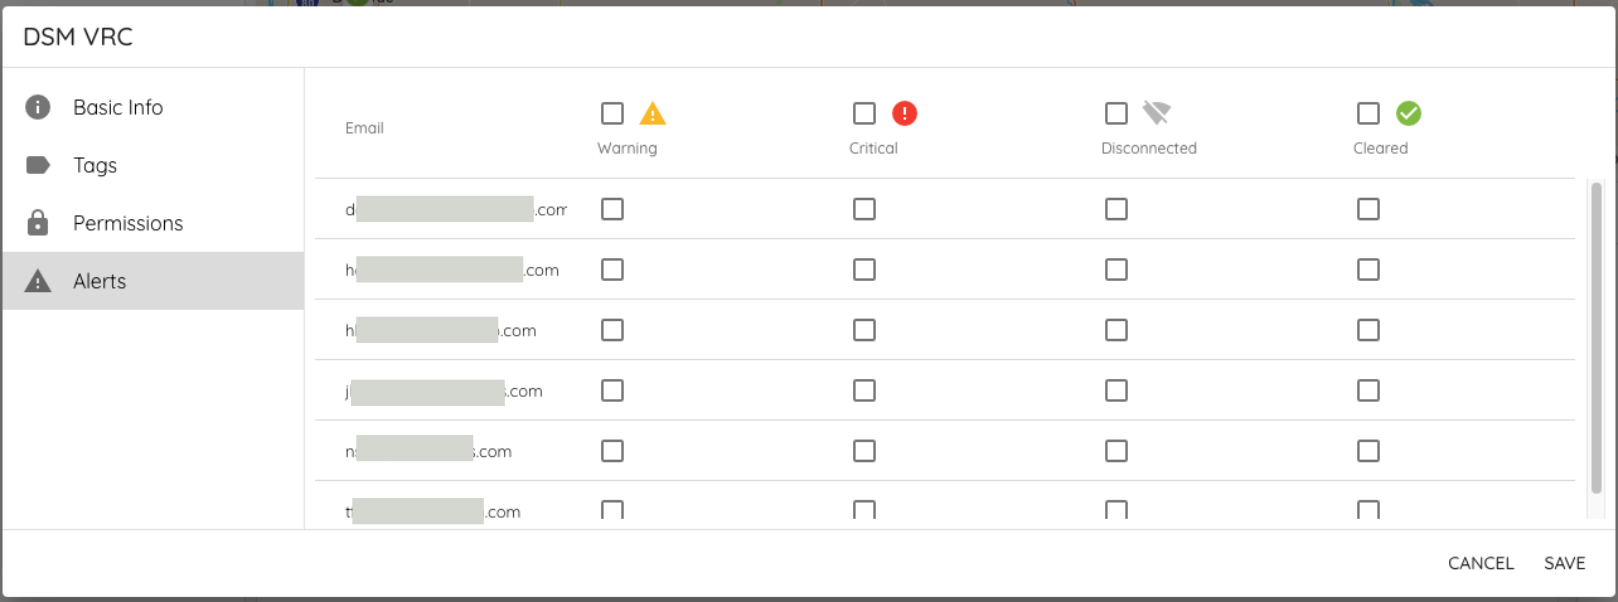
It’s important to note that Critical Labs sends alerts organized by data points in a dashboard, not directly from equipment. This helps remove annoyance alarms and allows different users to get alerted on different points from the same device.
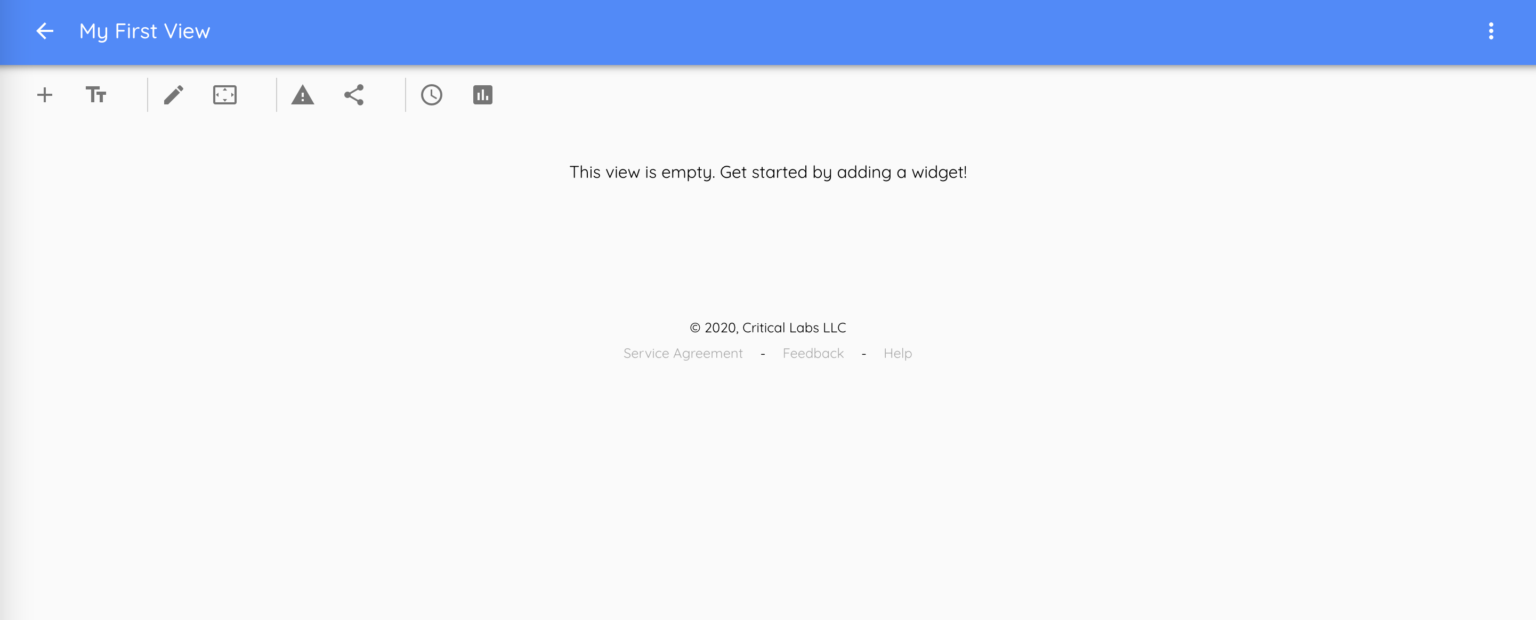
Once you are through setting up your settings, you can click Save to create your dashboard. This will take you to your new dashboard page.
Building a Dashboard
Permalink to “Building a Dashboard”If you have selected a template, then your new dashboard should have a number of widgets displayed on the screen. It is normal for the dashboard to not show data right away. Once the gateway polls on its next cycle (typically 5 minutes), then data should be present.
If you have opted to not use a view template, then you will need to setup widgets and alarm points yourself. You can add widgets to help you see all kinds of information about your device(s). Let’s first look at the top menu to show you what actions are available within a dashboard.
The Dashboard Menu
Permalink to “The Dashboard Menu”There should be a menu across the top part of your dashboard that looks like the following:
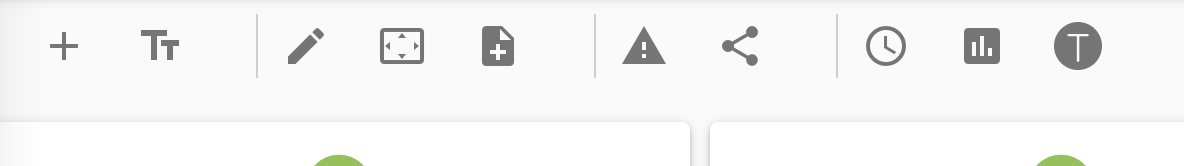
If you are missing some of the actions in the menu, it may mean that you do not have permission to do that action. Contact your system administrator to gain desired permissions.
Descriptions
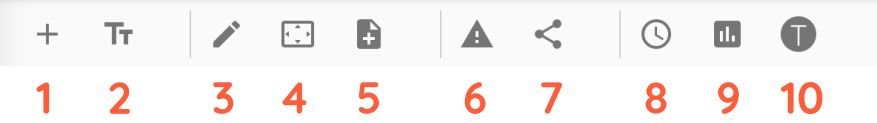
- Starting at the left, you will see the Add button. This allows you to add widgets to your dashboard. Widgets can show sensor data, trend data, text, images, and perform other specialized functions.
- The Add Header allows you to add headings to your dashboard to help organize your widgets. Headers span the entire length of the page and cannot be shortened.
- The Edit button allows you to rearrange the widgets on your dashboard, as well as to edit or delete individual widgets.
- The Screen Size button is a handy shortcut that allows you to see what a dashboard will look like on a mobile device. It also allows you to design your dashboards for both desktop and mobile independently, if desired.
- The Create a Template button allows you to create a view template from your dashboard. This template will copy the exact structure and data points that your view is pulling from your device(s) and saves it as a template that you can use for other views. View templates do not store sensor data, only structure. View templates are also frozen in time – this means that if you change your dashboard after templating it, the template will not update.
- Alert Settings is the exact same information contained on the alerts step when creating a view. It shows a list of users who can see the view and lets you assign who receives warning, critical, and equipment disconnected alerts.
- Share is the same information as the share step when creating a view, with added features. You can invite users from outside Critical Labs to see your view temporarily by generating a share link or invite a Critical Labs user to permanently see your view. You can also manage which users can see, edit, and share your view.
- The Set a Time Range button allows you to globally set the time range for any trend charts in your dashboard. Each trend can be updated individually, but this button will set the displayed time range for all trends.
- The Generate a Report button generates and downloads a basic PDF report of the data in your dashboard. This report will include drawings of trends, as well as a history of alerts within the time range currently being viewed in the dashboard.
- The View Traps button may or may not be available on your dashboard because not all equipment sends SNMP traps to Critical Labs. This is a handy shortcut to access traps if you are using them.
Adding a Widget
Permalink to “Adding a Widget”Begin by clicking the Add button in the dashboard menu.
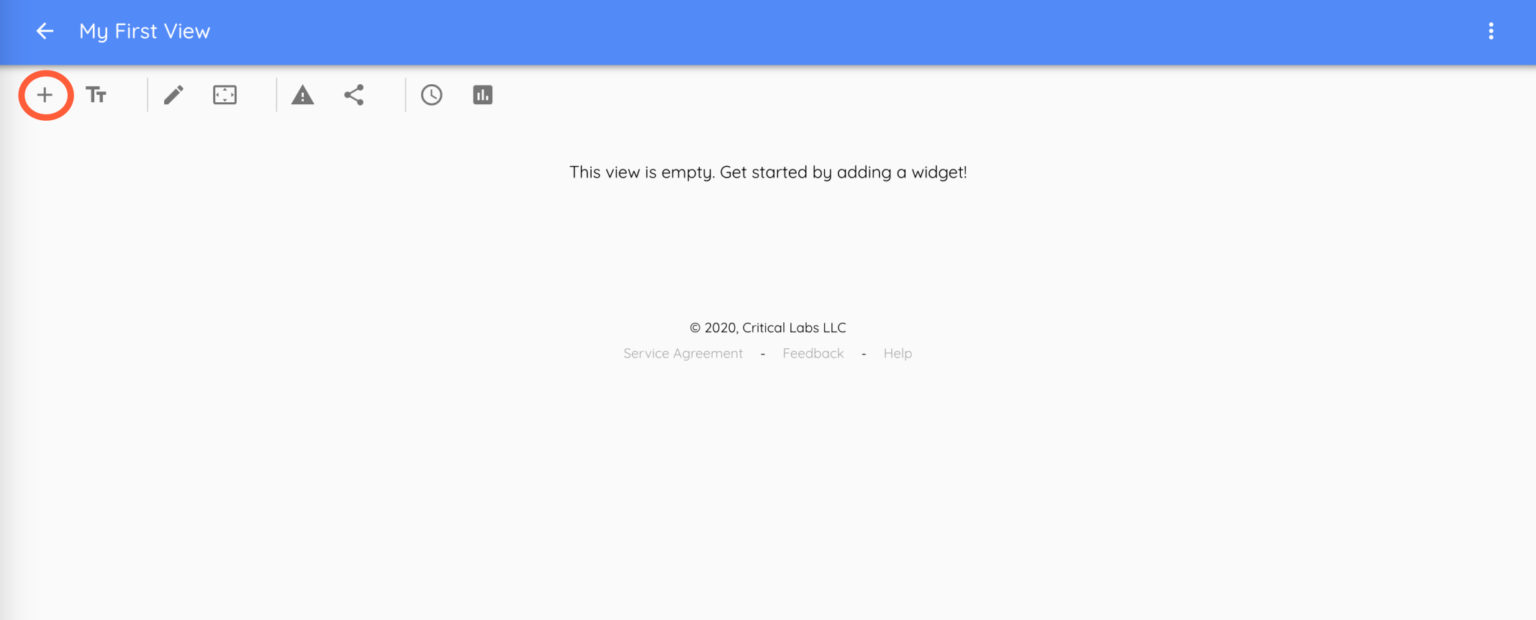
A screen will appear with steps to add a widget.
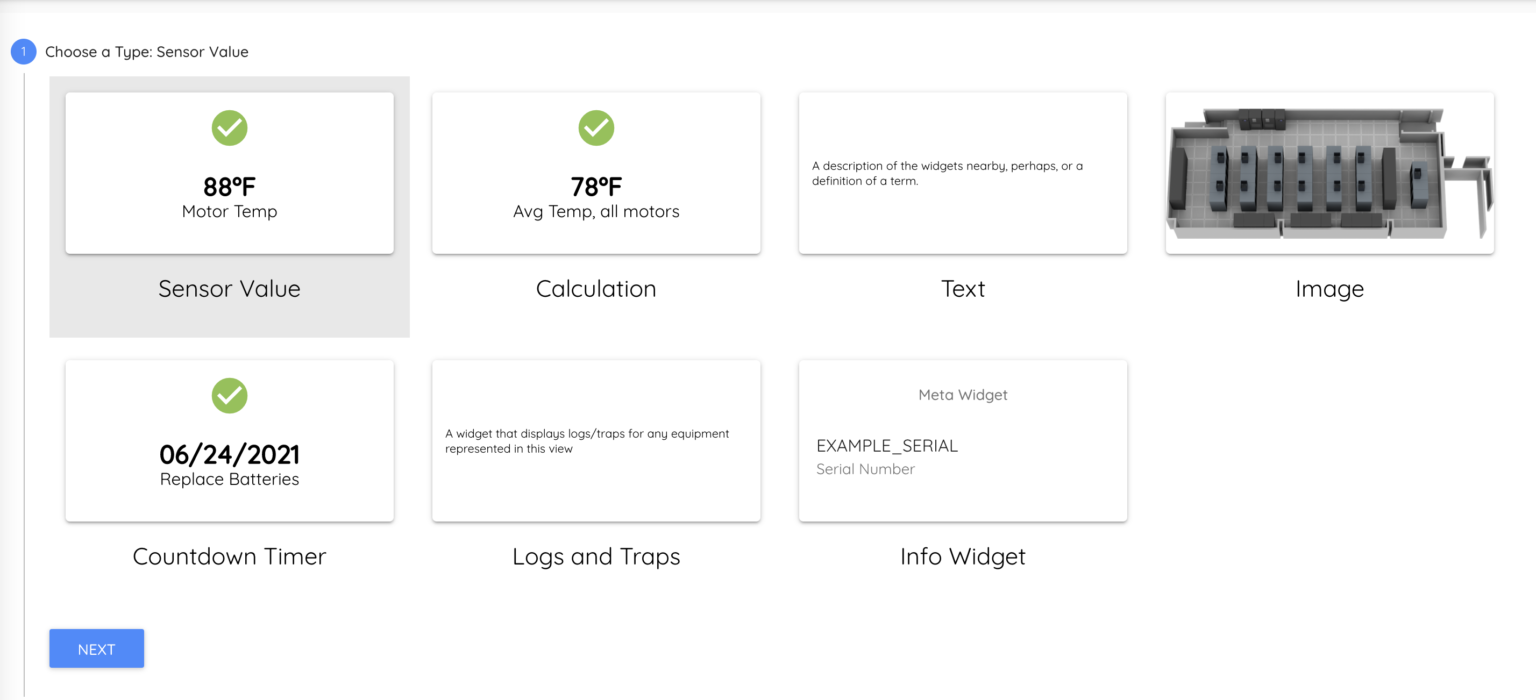
You will notice that there are many different types of widget in Critical Labs. This is part of what makes Critical Labs so flexible and powerful. You can combine any number of widgets to create a unique, customizable, and templatable dashboard.
Let’s choose the Sensor Value widget and click Next.
This brings you to the sensor selection step.
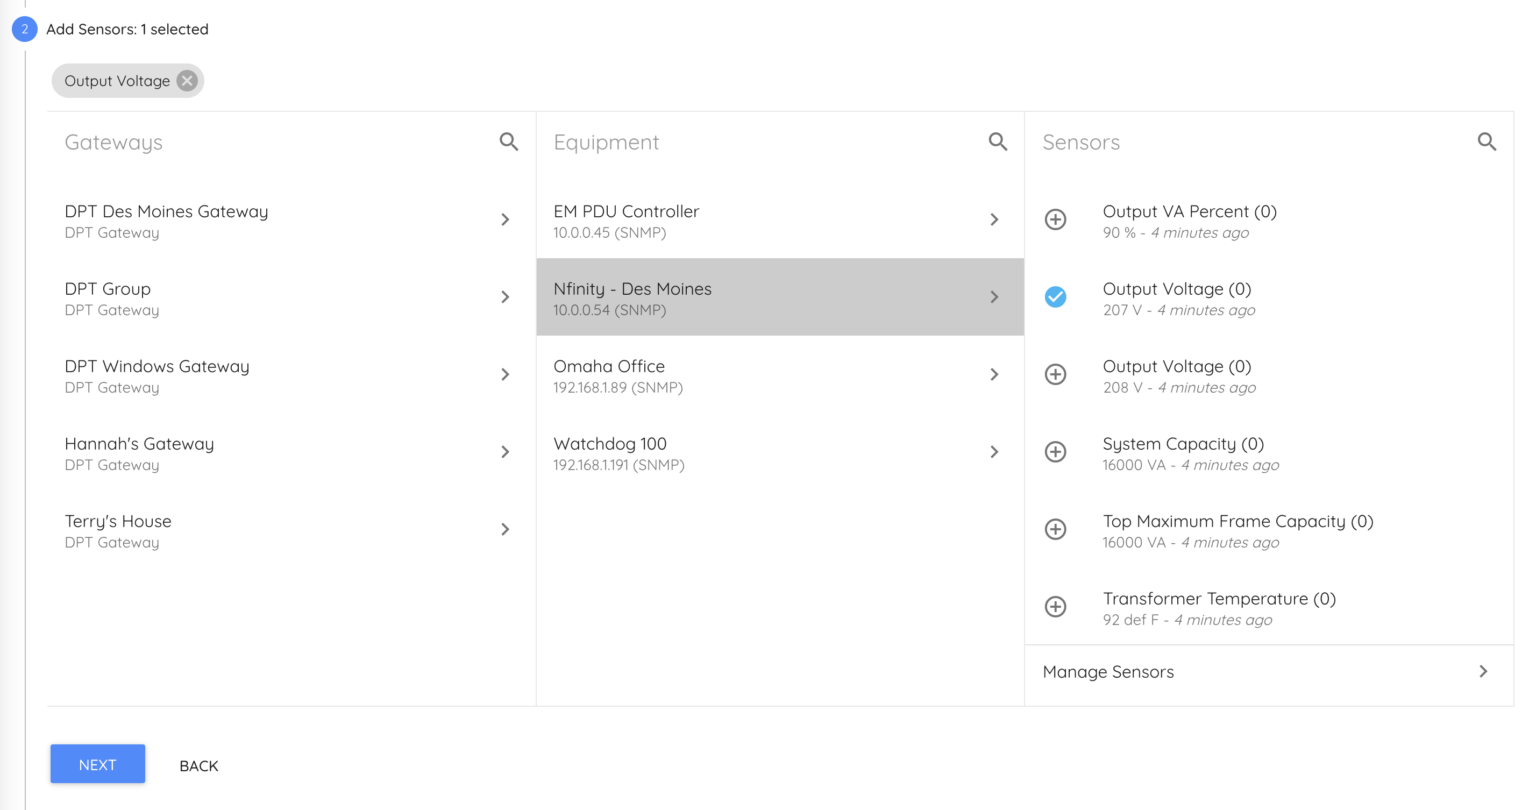
In this step you will add a data point (known as a sensor) from your equipment to the view. Notice that even though you selected your equipment when adding the view, you still have access to any device and/or sensor in your account.
Choose a sensor (or multiple sensors) and click Next.
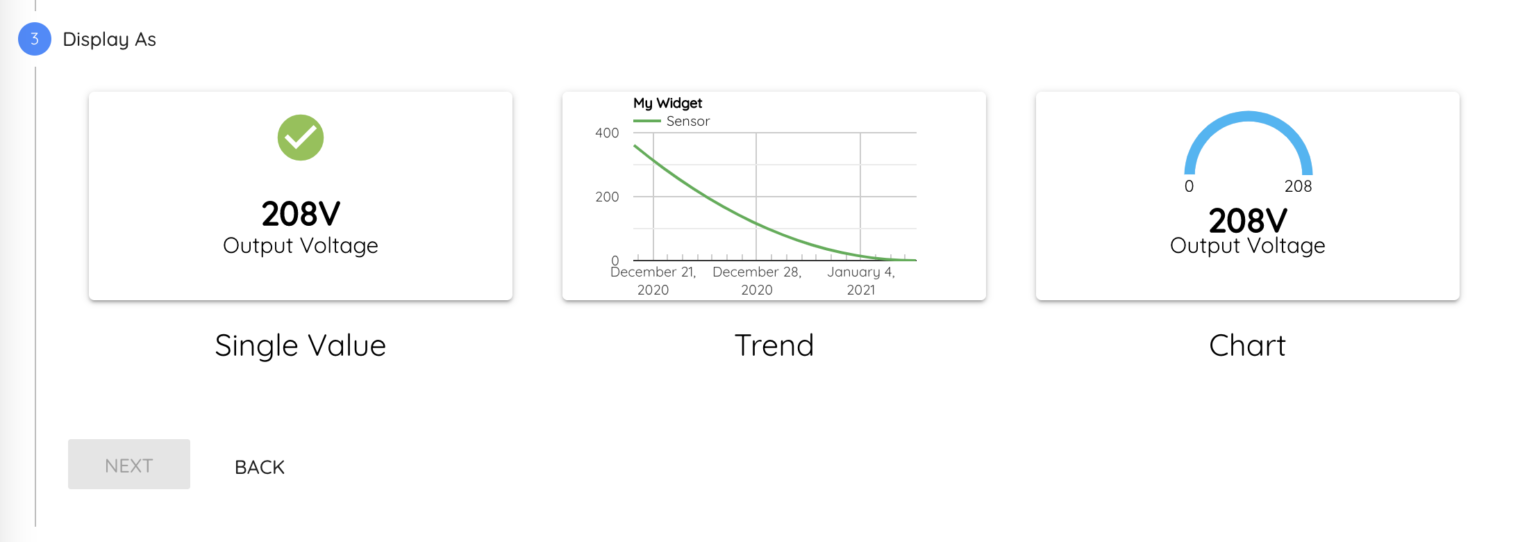
You will now see a list of display options for your sensor. Choose an option you would like to see. Click Next.
You may optionally add a link to your widget that will be displayed directly on the widget. This is useful if you want to have local links to your devices (only works on the same network as the device) or to link to offsite documentation.
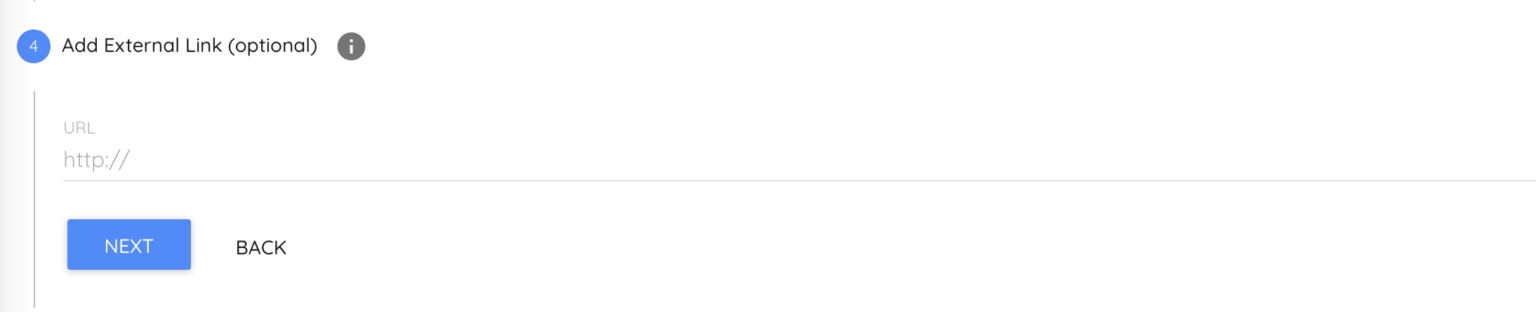
Click Next.
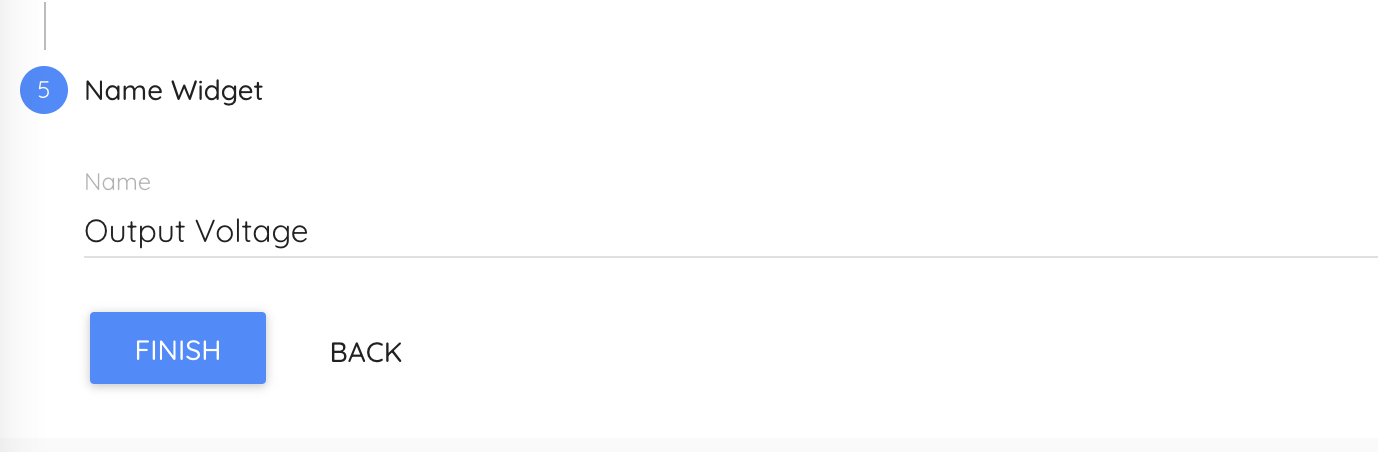
Lastly, give your widget a name. You may use the default name Critical Labs assigns or come up with your own.
Click Finish.
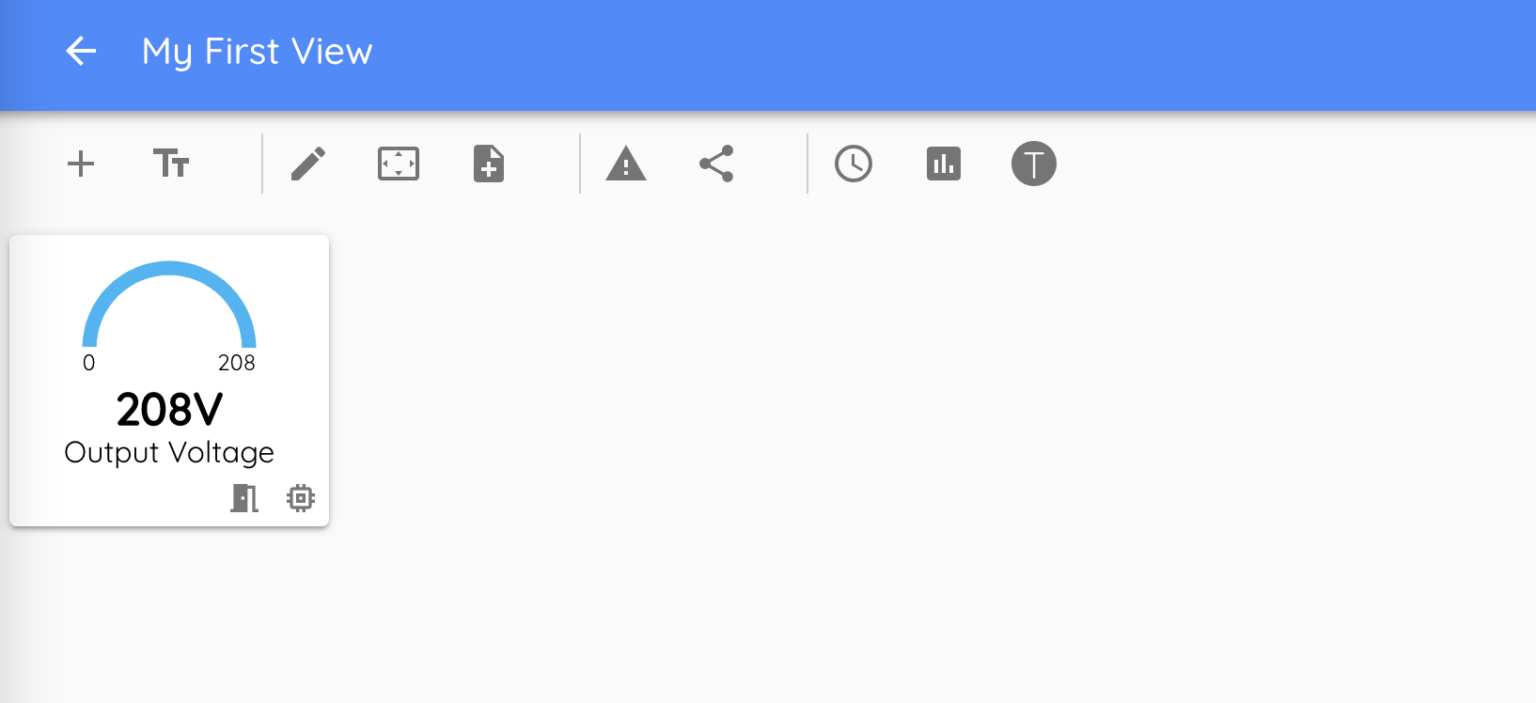
Congratulations on making your very first widget! Feel free to experiment with adding more widgets of different types, and editing the dashboard to rearrange the layout.