PDF Reports
Did you know that dashboards have a PDF report feature? This report contains a snapshot of the data in a dashboard over a period of time, including trending and alarm logs. The report also contains minimum, maximum, and average data for any data points that have a trend chart in the dashboard. An example can be seen below:
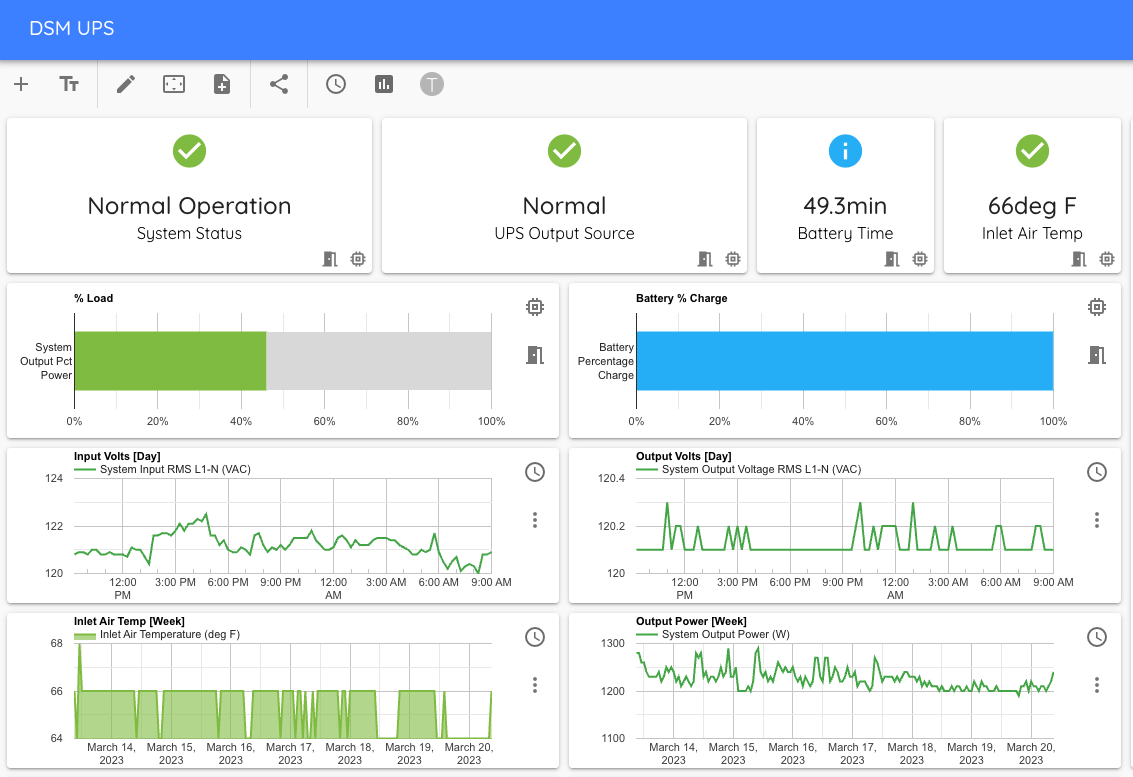
This dashboard has a number of trend charts, as well as a combination of trend charts and simple value widgets. When a PDF report is generated, it looks like this:
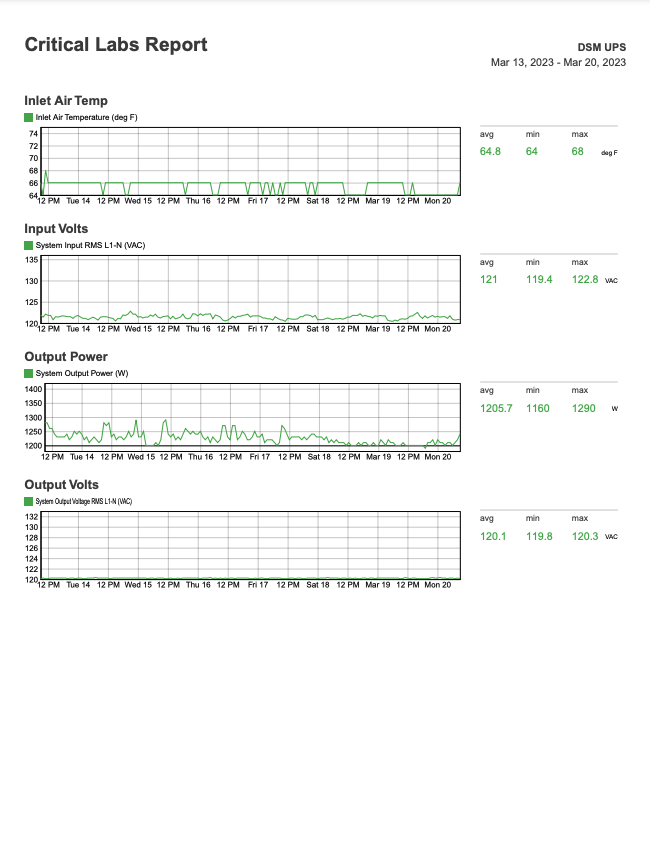
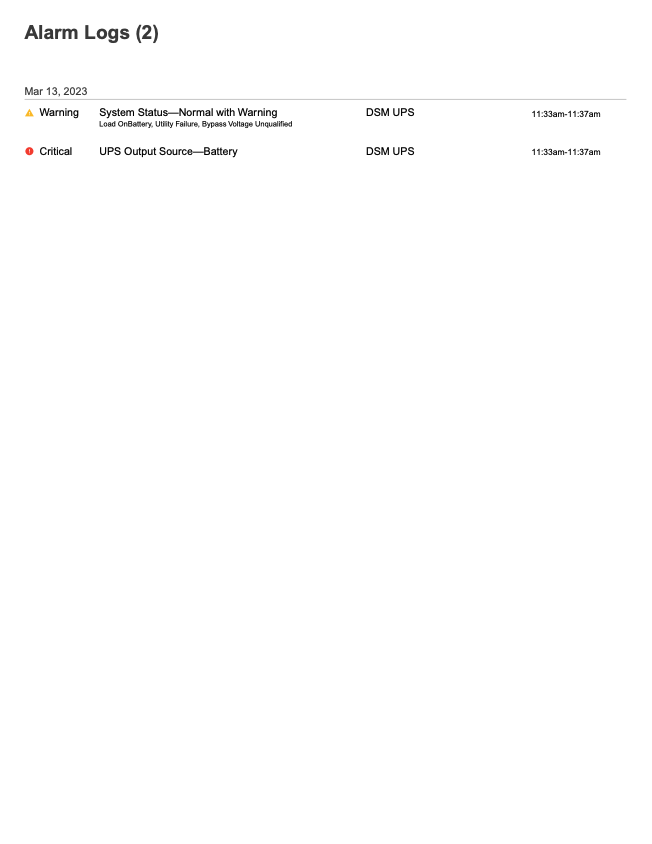
Notice how each trend chart has a corresponding trend chart in the report, as well as min/max/average for each data point on the trend chart. At the bottom of the report, an alarm log shows any warnings or critical alarms that have been triggered on any data point contained in the dashboard - even data points that are not in a trend chart.
Download a Report
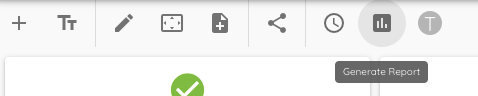
Permalink to “Download a Report”To download a PDF report, go to the dashboard for which you want a report. In the top toolbar, click on the Generate Report button.
A menu will pop up, asking you to select a time range for the report.
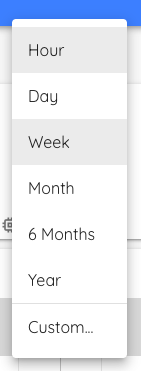
Select a timeframe, and a corresponding PDF report will display within a few seconds.