Equipment Page
The equipment page is a very useful and convenient view for adding, managing, and viewing an aggregated list of all your devices connected to Critical Labs. It allows you to do host of maintenance and management tasks, including bulk adding and updating devices, Critical Labs gateway management, updating alarm thresholds, and viewing aggregated alarm logs.
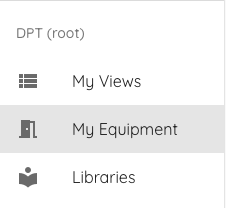
You can access this page by going to the top righthand menu and selecting My Equipment.
Equipment Tab
Permalink to “Equipment Tab”The equipment tab provides a list of all devices that are currently being monitored by Critical Labs. It provides very handy filter and sort options, as well as search capabilities, to help you get useful lists of your devices.
For example, you can find all devices that are currently disconnected (not currently reporting to Critical Labs) or devices that are currently set to maintenance mode (devices that are not currently sending alarms).
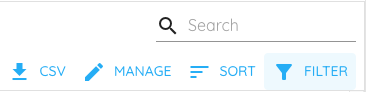
You can also perform a handful of actions by pressing the Manage button at the top of the equipment list.
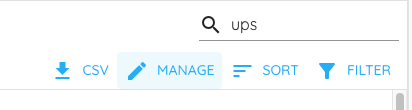
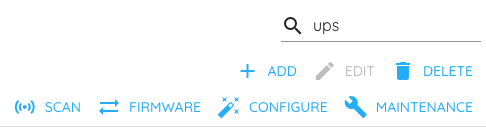
These actions include:
- Scan - Takes you to the Find Equipment page. Allows you to run scans that detect Critical Labs-compatible devices on your network.
- Firmware - For supported devices, Critical Labs can update network card firmware to the latest available version.
- Configure - Configure network cards remotely. See Configuring Web Cards for more information.
- Maintenance - Put a list of devices into maintenance mode (silence alarms).
Equipment Details
Permalink to “Equipment Details”You can select a device from the list and see much more detail about the device, including:
- Info - basic connection information
- Sensors - alarms and/or data points currently being monitored by Critical Labs for the selected device
- Traps - a list of historical SNMP traps, if applicable
- Logs - a log of recent alarms captured by Critical Labs
- Views - a list of dashboards and overlays that this device appears in
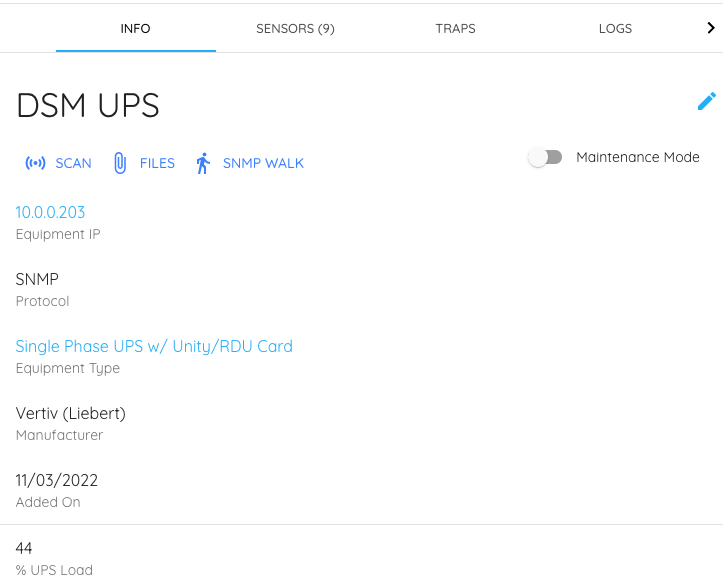
From the equipment detail page, you can also:
- Scan the IP of the device, allowing you to get current connection information
- Retrieve diagnostic files from the device (for supported Vertiv devices)
- SNMP walk the device
- Put the device into maintenance mode (silence alarms)
Searching and Filtering Equipment
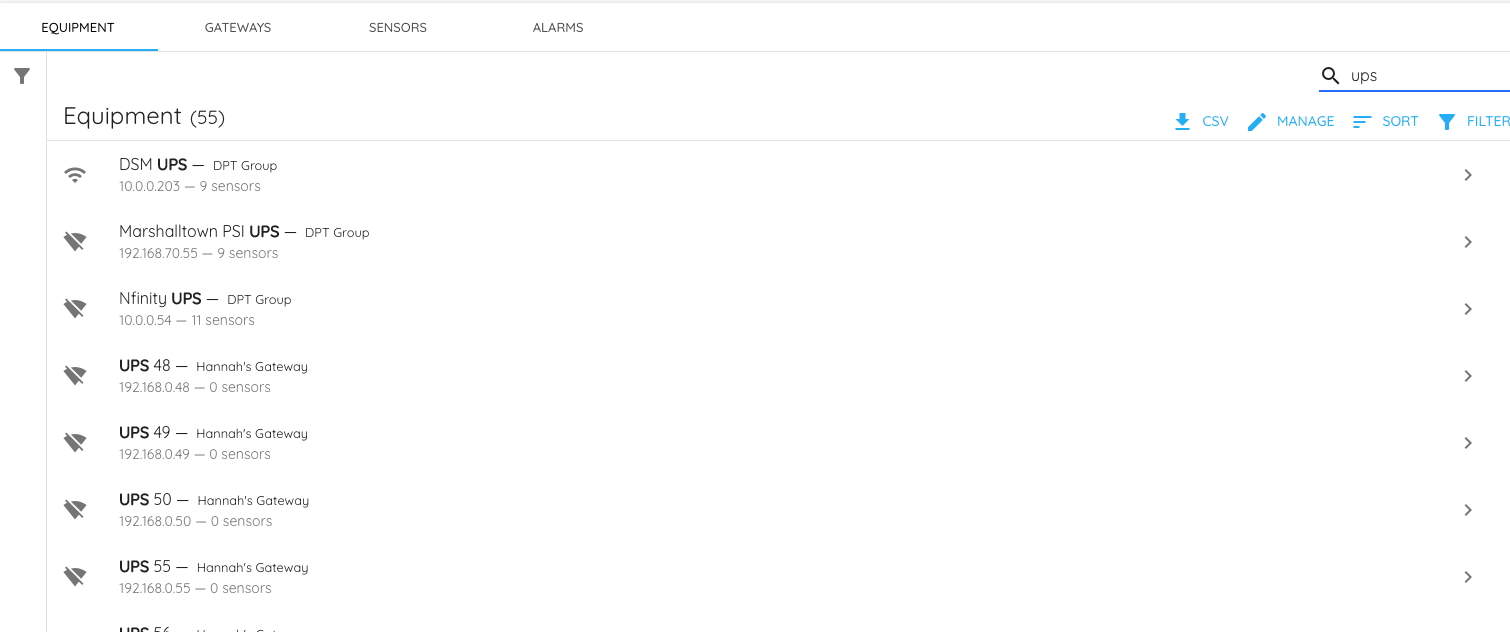
Permalink to “Searching and Filtering Equipment”Searching for equipment using the search bar matches on device name or device ip.
Note that search terms are not exact and are not case-sensitive, so searching "ups" will return devices named "UPS1", "UPS2", "My UPS", etc.
There are many filters available to help narrow down equipment search. You can access these by clicking the Filter button under the search bar.
Current available filters are:
- Connection Status - Whether the device is currently connected to Critical Labs or not. Options are "Connected" and "Disconnected".
- Gateway - The name of the Critical Labs gateway that this device is reporting to. Options are any active gateways (hardware appliance or VM) associated with the account.
- In Maintenance Mode - Whether the device is in maintenance mode. Options are "Yes" and "No". If a device is in maintenance mode, it will not notify on alarms.
- Protocol - The protocol currently being used by Critical Labs to communicate with the device. Options are "SNMP" and "Modbus".
- Has Connected Before - Whether the device has ever connected to Critical Labs. Options are "Yes" and "No".
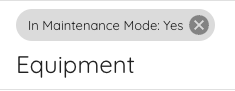
Filters and search can be used together to help form ad-hoc reports of your environment. For example, to figure out which devices with "GXT" in the name that are in maintenance mode, do the following search and filter:
Search bar: GXT
Filters: In Maintenance Mode - Yes
You can clear filters by clicking the "X" next to name of the filter at the top of the equipment list.
Gateways Tab
Permalink to “Gateways Tab”The gateways tab is how you activate and manage the Critical Labs gateway (appliance or VM agent). This tab will show you a list of your active gateways, their status, and their last check-in time.
Clicking on a gateway will provide more detail about the gateway, including its firmware version, configured polling cycle, connection status, and a list of Gateway Actions that are currently being executed by the gateway.
Sensors Tab
Permalink to “Sensors Tab”The sensors tab lets you see all sensors (alarms and/or data points) that are currently being monitored by Critical Labs. It is an alternate way to view sensor data from the equipment tab.
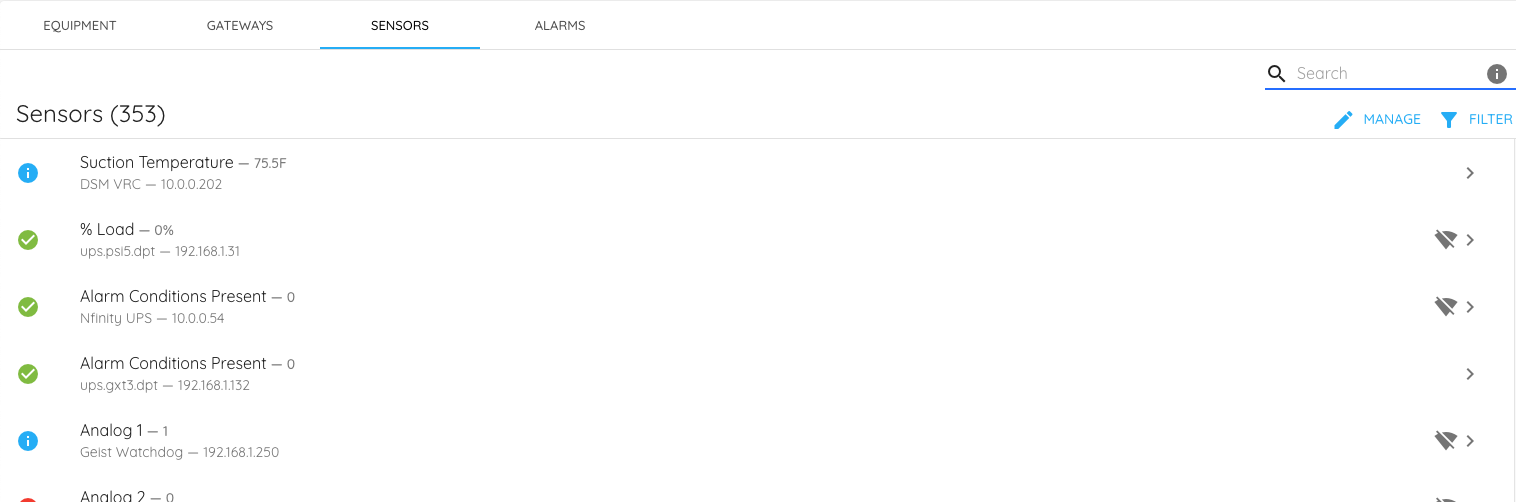
The sensors tab is especially useful if you need to bulk update sensors of a certain type. For example, if you want to lower the temperature alarm threshold for all of your devices, you can simply search "temperature" in the sensors tab, select all the temperature sensors, and update their thresholds in bulk with a single button click.
Searching and Filtering Sensors
Permalink to “Searching and Filtering Sensors”Critical Labs has a very powerful and convenient way to search and filter sensors, making it simple and fast to build ad-hoc reports on sensor health, status, and configuration.
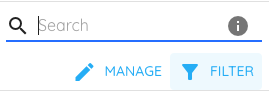
The search bar itself has a smart search capability. By simply searching a term, such as "temperature", a list of sensors will return with "temperature" in the name (search is not case-sensitive). However, there are far more detailed searches that can be performed. You can find the list of search options by clicking the info icon on the search bar.

The current available search options are:
- ip - The device IP address
- device - The device name
- unit - The device unit
- oid - The SNMP OID (SNMP sensors only)
- alarm - System status alarm detail
Search Examples
To find all temperature sensors on devices in an IP subnet 192.168.1.0/24, search:
temperature ip:192.168.1
To find Battery Time Remaining on any device with "UPS" in the name, search:
battery time remaining name:ups
To find all sensors on any device with "UPS" in the name, search:
name:ups
Note that multiple words are supported in search terms. Also, search terms are not exact, so searching "temperature" will return sensors named "Temperature", "Inlet Temperature", etc.
Note that you must search the sensor name first when searching with options. The format should always be:
sensor name option:value option2:value2...
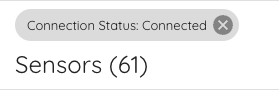
Filters are another great way to find sensors that you are looking for. These filters can be used in combination with search. You can add filters by clicking on the Filter button underneath the search bar in the sensors tab.
Currently available filters for sensors are:
- Connection Status - Whether the sensor is connected to Critical Labs or not. Options are "Connected" and "Disconnected".
- Data Collection Type - How much data Critical Labs is polling from the sensor. Options are "Full data" and "Alarms only". Full data sensors are meant for data points that can be trended over time, such as temperature. Alarm only sensors are meant for alarm data points, such as System Status.
- Has Alarm Delay - Whether the sensor has an alarm delay set. If not set, the alarm will notify immediately when received from the device. If set, Critical Labs will wait for a specified period of time before notifying, quieting noisy sensors. Options are "Yes" and "No".
- In a Dashboard - Whether the sensor is present in a dashboard. A sensor must be present in a dashboard to receive notification of an alarm. Options are "Yes" and "No".
- Device Connection Status - Whether the sensor's device is connected to Critical Labs or not. Options are "Connected" and "Disconnected".
- Device Has Connected Before - Whether the sensor's device has ever connected to Critical Labs or not. Options are "Yes" and "No".
Filter Example
To find all sensors named "Battery Time Remaining" that do not have an alarm delay set, do the following:
Search bar: Battery Time Remaining
Filters: Has Alarm Delay - No
You can clear filters by clicking the "X" next to name of the filter at the top of the sensor list.
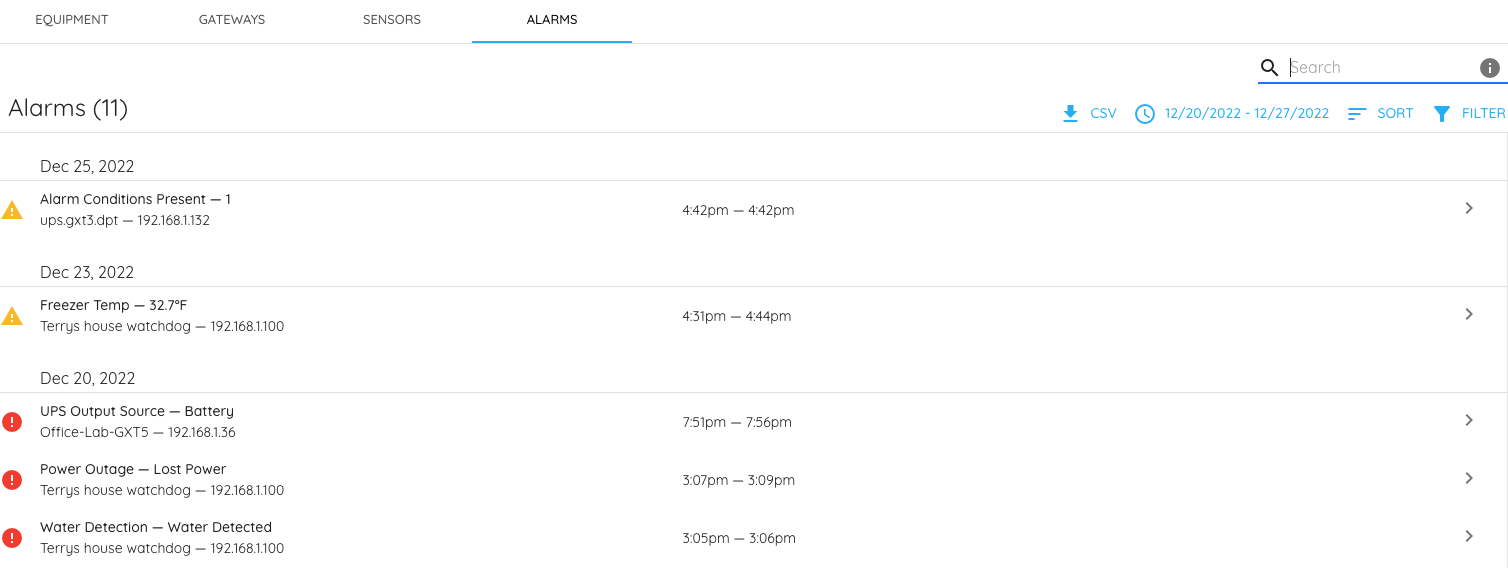
Alarms Tab
Permalink to “Alarms Tab”The alarms tab lets you see all alarms processed by Critical Labs over a period of time (one week by default). This tab shows you which alarms triggered, when they triggered and/or cleared, and additional SNMP trap information, if available. This log can be downloaded as a CSV file for users with the manage equipment permission.